Ford Bronco Intercooler Upgrade
With nearly a decade of experience modifying EcoBoost powered Fords, we at COBB have found that the factory equipped intercooler can represent a significant performance limitation. Add on the sort of big bumpers, winches, and accessories found on many new Broncos, and the limitation can get even more severe. We’re happy to have introduced an industry-leading intercooler solution for the 2.3 and 2.7 EcoBoost Broncos and wanted to share some of the R&D that went into this project. If you’re looking for more options, check out our full list of Ford Bronco mods.
What is an intercooler and why do we need one?
An intercooler is a heat exchanger located in the intake tract of the engine between the turbo(s) and the throttle body. An intercooler is a necessary device used in forced induction applications – both turbocharged and supercharged – as air temperature will increase when pressure is increased. Increased air temperature can hinder safe torque and power production in a few ways, but the most important factors are as follows:
- The Ideal Gas Law (PV=nRT) tells us that warmer air is less dense than cool air at a given pressure. This means that there are fewer oxygen molecules to combust with fuel, resulting in less torque and horsepower.
- Warmer air creates warmer combustion chamber temperatures that can decrease the knock threshold. This requires the use of an ignition timing compensation to retard timing when post intercooler air temperature (charge air temperature) is elevated to keep the engine safe and knock-free. Less ignition timing advance (generally speaking) will cause the combustion event to occur at a less energetically efficient point of the crankshaft’s rotation, decreasing torque and horsepower.
An efficient intercooler design will be able to offset the heat added to the air charge by the compressor and mitigate torque and power losses.
Testing Procedure:
The experience that our hard parts team has with the Ford platform and intercooler design allowed us to narrow down our prototype core designs to two options for the Bronco. To select the best one and measure performance improvement compared to stock, we needed to create a test procedure.
A: Controls
In order to have the best and most comparable data, we needed to control for as many variables as we could. Testing was performed on the same day for all intercoolers with less than a 2*F variance in ambient temperature (between 102-104*F) and no variance in barometric pressure (14.24 psi). All testing was done on the same vehicle, our R&D Bronco 2.7 w/ Sasquatch Package, and on the same Mustang MD500 AWD dyno running in RWD. This entire procedure was repeated with our R&D Bronco 2.3 which yielded similar results, but this write-up will focus on the 2.7. The ECU was running the factory calibration and was fueled with the same tank of 93 OCT. Mileage accumulation was performed on the road prior to dyno testing to make sure that the octane learning system had settled, and the ECU was not reset at anytime during this test sequence. Our dyno room uses a massive fan that pulls air though a 3ft. by 3ft. duct, generating a constant 42 MPH and roughly 32,000 CFM at standard temperatures/pressures.
B: Sensors
Modern production vehicles are already bristling with sensors and modules, so it may seem odd to need additional sensor equipment to perform development testing. All EcoBoost Fords, including Broncos, have sensors to collect ambient air temperature, intake air temperature (pre-turbo), charge air temperature (post-turbo, post-intercooler), throttle inlet pressure, and intake manifold pressure. We wanted to add sensors to measure temperature and pressure drop across the intercooler. We used an auxiliary logging module and four sensors to gather this data:
- Pre-intercooler pressure sensor
- Pre-intercooler temperature sensor
- Post-intercooler pressure sensor
- Post-intercooler temperature sensor
These sensors were plumbed into the charge pipes just before and after the intercooler end tanks. The logging module we used was an AQ-1 from our friends at AEM, collecting data at approximately 100 Hz.
C: Testing
For each intercooler, we wanted to evaluate performance through a single gear pull, temperature efficiency, and pressure drop. Each intercooler saw seven 4th gear pulls, broken down as follows:
- 3 pulls, each separated by a 3 minute stationary cool-down period with engine and dyno fan running.
- 10 minute stationary cool-down period with engine and dyno fan running.
- 4 pulls, each separated by a 1 minute stationary cool-down period with engine and dyno fan running.
Prior to the first pull on each intercooler, the vehicle was brought up to temperature such that starting coolant, transmission fluid, and charge air temperature was equal. Sample size was determined by the testing window limitations posed by ambient conditions – ultimately, a reduced sample size was chosen to minimize variability of ambient temperature.
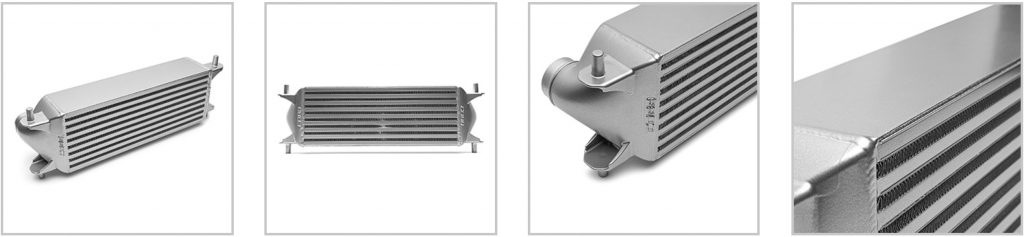
Test Subjects:
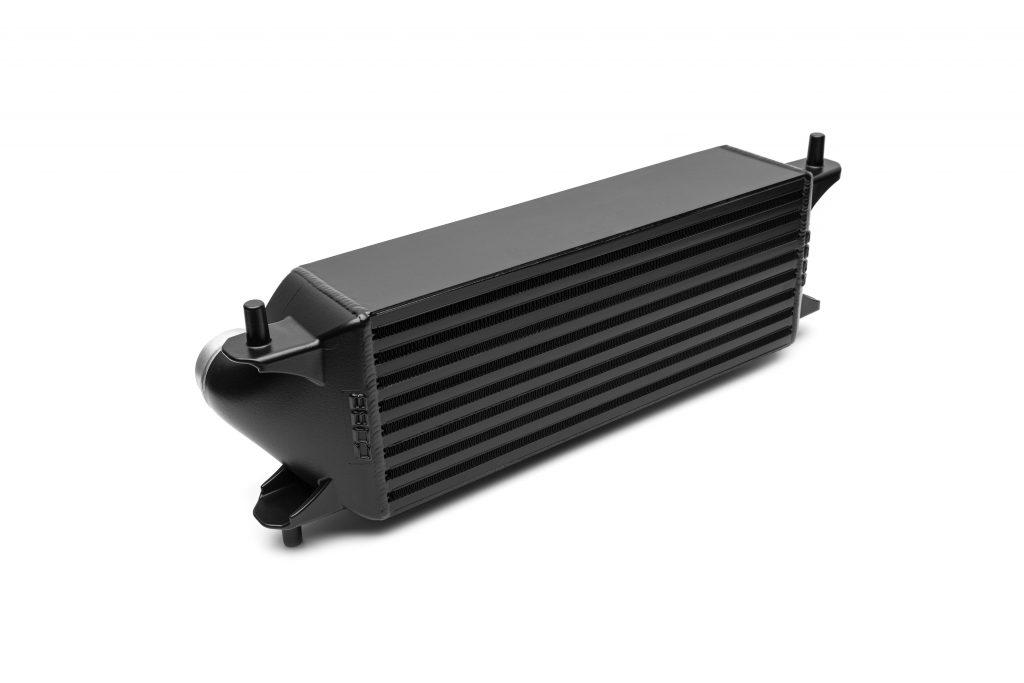
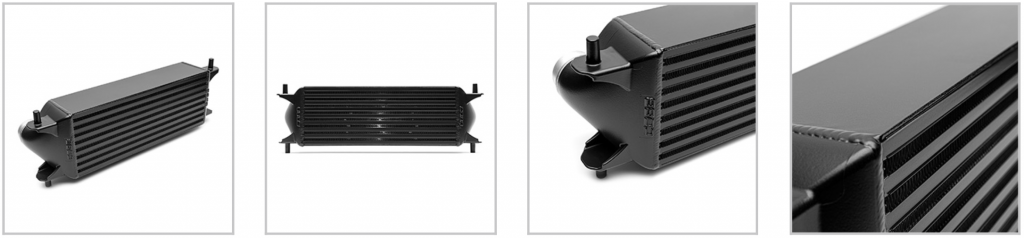
This experiment compared the factory Bronco intercooler to two different COBB prototype intercoolers. All three intercoolers used the factory charge pipes and couplers on the hot and cold sides. The COBB intercooler prototypes both used the same end-tanks, machined from billet but otherwise identical to production cast units. Overall dimensions of the prototype intercoolers were identical, and general construction was similar as bar-and-plate style heat exchangers. The primary difference between the prototype intercoolers was the core design, namely in the charge-side fin density. Core design 1, hereafter “COBB1”, used a much higher charge-side fin density. Core design 2, hereafter “COBB2”, used a charge-side fin density closer to factory specification.
Increasing charge-side fin density typically offers an improvement in heat exchange between the charge air and the intercooler/atmosphere. However, this can come at the cost of increased pressure drop and flow restriction. Our goal in this experiment was to establish which solution proved best on the Bronco.
Results:
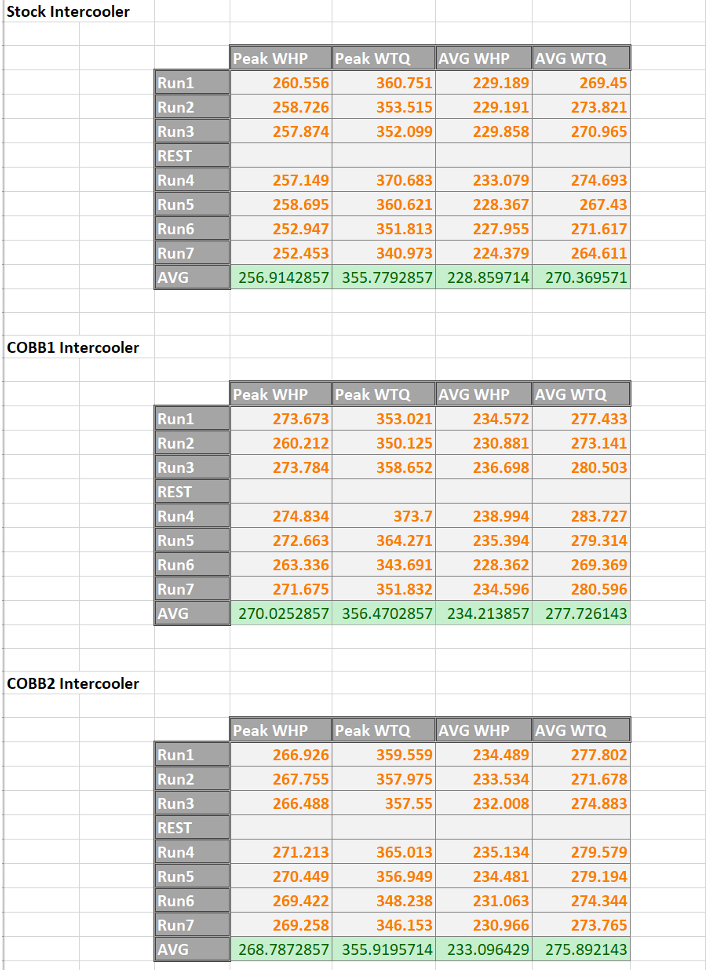
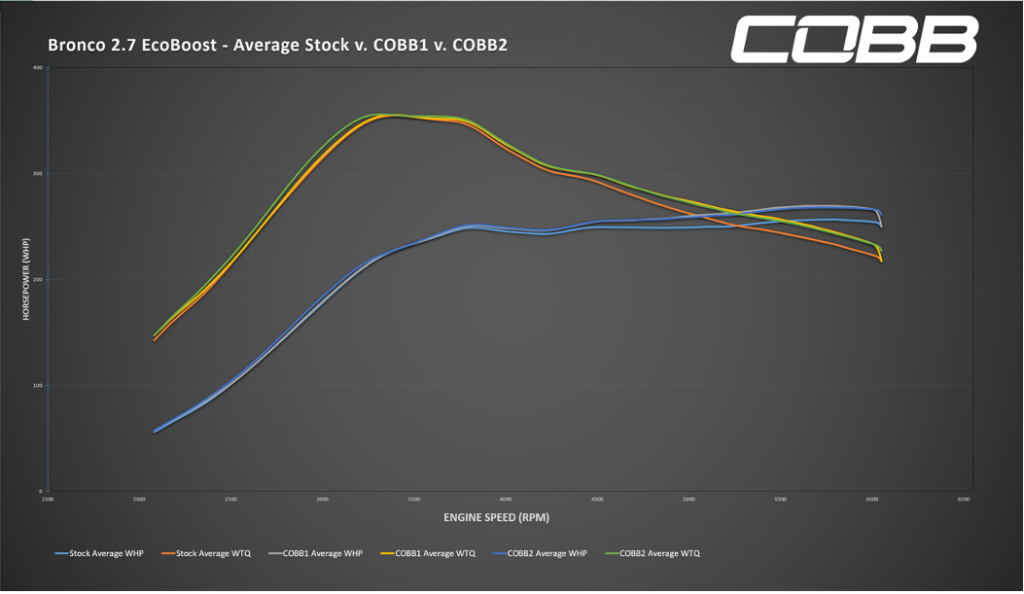
A: Power/Torque
Dyno results are as follows. Pulls started at 1800RPM and ended at approximately 6200RPM. Values are shown in SAE corrected units. Peak WHP/WTQ values are defined as the highest HP/TQ values collected by the dyno at any point during the power pull. AVG WHP/WTQ values are defined as the average of all WHP/WTQ datapoints collected during the pull, including spool. Runs 1-3 were separated by a 3-minute cool down period. The ‘Rest’ was a 10-minute cool down period. Runs 4-7 were separated by a 1-minute cool down period.
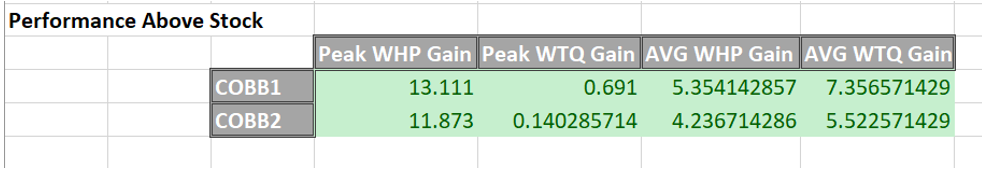
Values shown in the table below represent the increases in average peak and AVG WHP/WTQ compared to the stock intercooler.
The graph below shows averaged values for each seven runs for each intercooler.
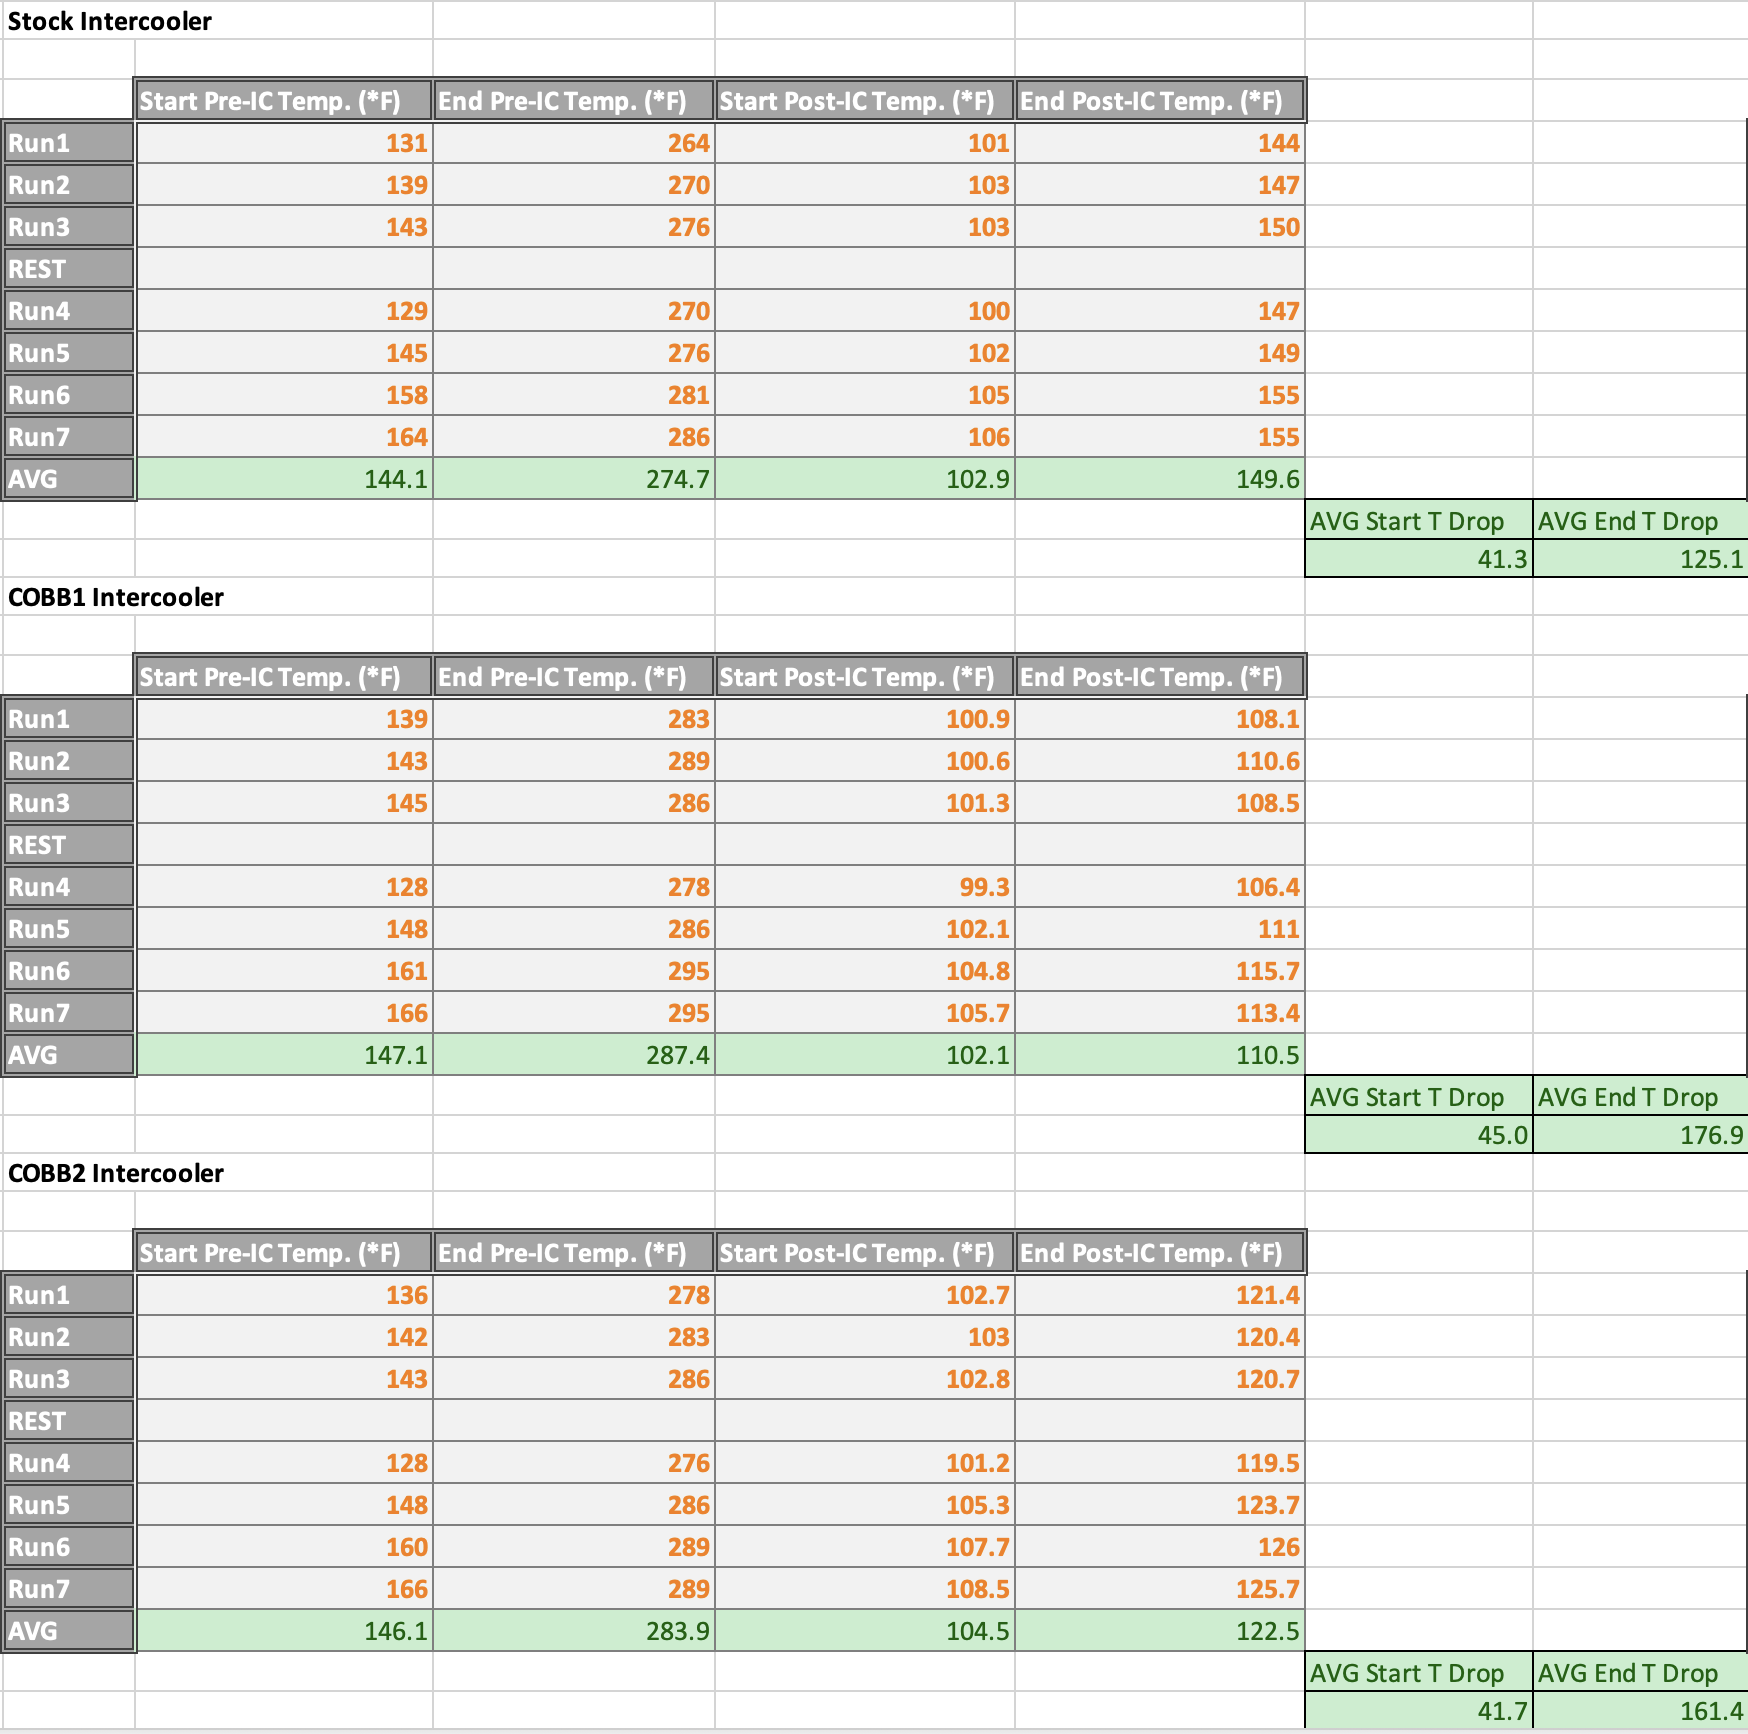
B: Temperature Efficiency
Temperature sensors pre- and post-intercooler were logged during each pull. Starting and ending air temperatures were entered into the table below and then averaged. These averaged values were then compared to show the decrease in temperature between start and end at each location, labelled AVG Start T Drop and AVG End T Drop.
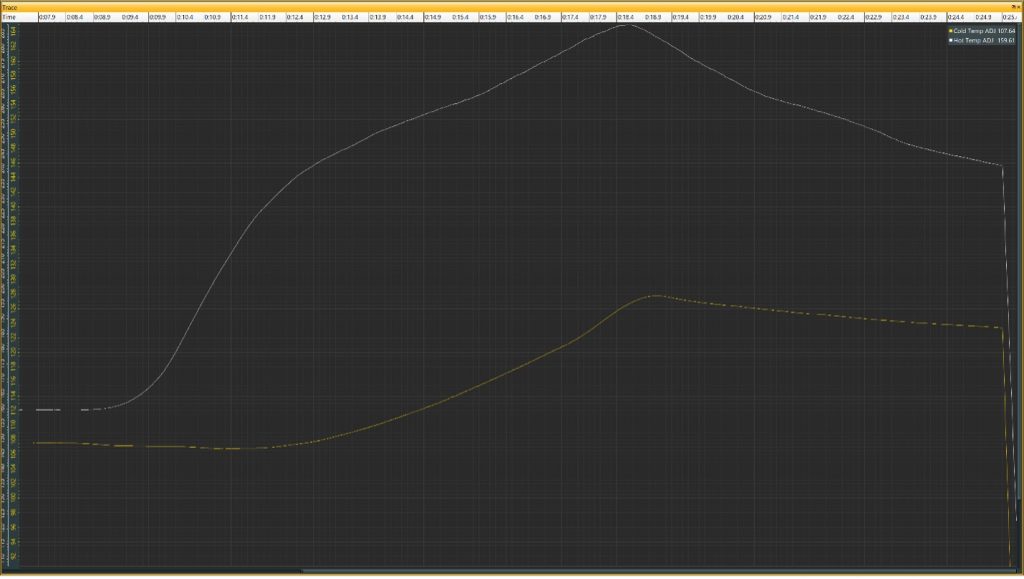
The graph below shows an example of the temperature curves through a pull – the white line shows filtered post-intercooler temperature and the yellow line shows filtered pre-intercooler temperature. As the pull begins, we see a small drop in post-intercooler temperature, then a steady rise; pre-intercooler temperature increases dramatically during spool and then continues to increase towards redline. The respective peaks of both curves show the end of the power pull.
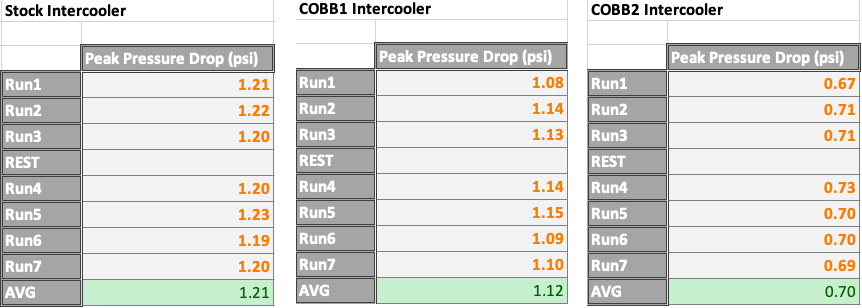
C: Pressure Drop
Pressure sensors located in the charge pipes pre- and post-intercooler were logged during each pull. By subtracting post-IC pressure from pre-IC pressure, we were able to plot pressure drop across the intercooler through the pull. From this data, we found the peak pressure drop and recorded it in the table below for each run. Values were then averaged. Pressure data is not temperature corrected and does not account for pressure drop due to cooling.
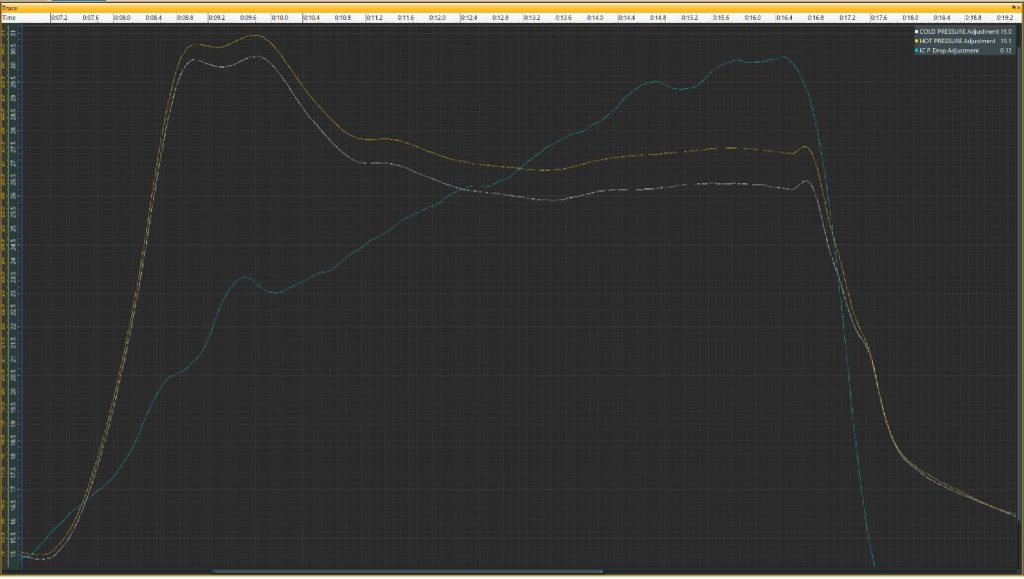
The graph below shows an example of the pressure curves through a pull – the white line shows filtered post-intercooler pressure, the yellow line shows filtered pre-intercooler pressure, and the blue line shows a calculated pressure drop. Note that the pressure drop plot is scaled differently from the pre- and post-intercooler pressure readings. Pressure drop generally increases with air mass flow and RPM.
Analysis:
It is important to analyze these results not only from the perspective of physical change – namely air temperature and airflow restriction – but also from the perspective of control change. EcoBoost Fords use highly dynamic boost and ignition controls strategies. These strategies react directly to measured charge air temperature. While we do not yet have the ability to flash the Bronco ECUs, we can look at calibration data from these relevant tables in similar vehicles. The following screenshots of calibration data are sourced from a 2020 F150 2.7 EcoBoost.
Ignition timing is impacted by charge air temperature through the charge air temp. (CAT) timing compensation. This compensation is the product of two tables – Timing Comp. (CAT) and Timing Comp. Mult. (CAT), shown below:
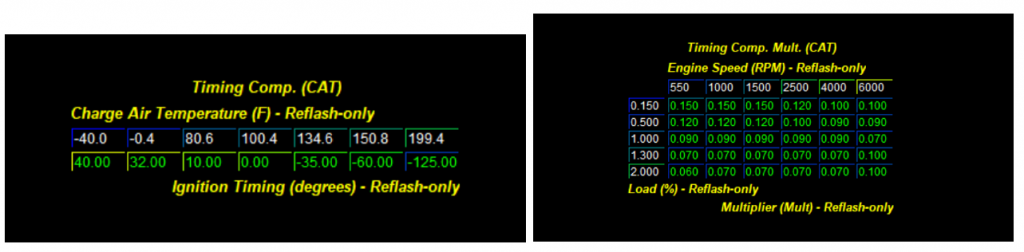
Measured charge air temperature is used to source a value from the Timing Comp. table, which is then multiplied by a value in the Timing Comp. Mult. Table. For example, at a charge air temperature of 134.6*F, engine load of 2.0, and engine speed of 6000RPM, we would see a net timing compensation of (-35*)(0.1) = -3.5*. This value is applied to a specific spark source – called ‘Borderline Timing’ or Spark Source ‘2’. We typically see this Borderline spark source in use at high load and warmer operating temperatures, such as the conditions we tested these intercoolers.
Boost control is impacted by charge air temperature through a series of tables that can limit load based on learned octane and charge air temperature. The LSPI High, Mid, and Low tables are interpolated between one another based on the learned octane value. When inferred octane is high, the ECU will run the values in the LSPI High table. When inferred octane is low, the ECU will run values in the LSPI Low table. We ran our Bronco on the street for a few tanks of 93 OCT fuel, which should have allowed the octane learning system to learn to its maximum, so we will only be looking at the LSPI High table shown below:
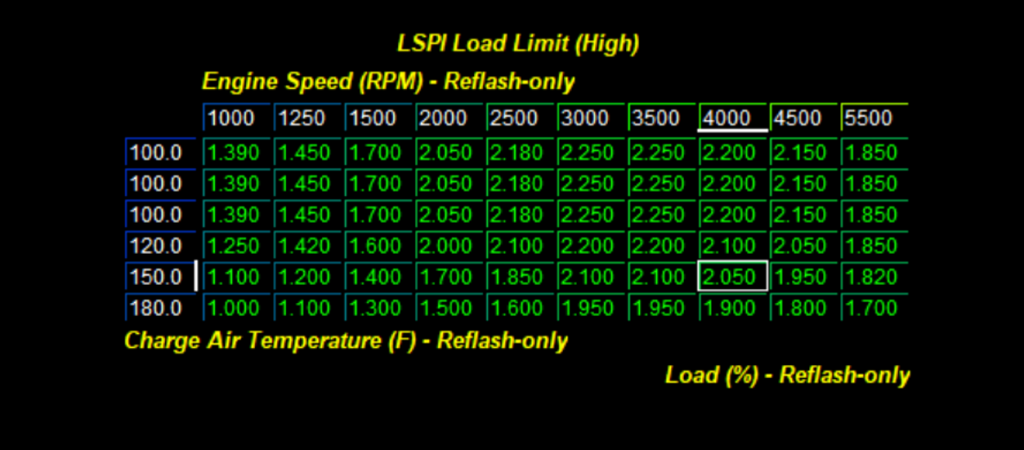
Values shown in this table are representations of air mass, which will generally trend with boost pressure. As charge air temperature increases in the Y-axis, you can see that load limits become lower and lower. For example, at 100*F charge air temperature and 4000RPM, load will be limited to 2.2, compared to 1.9 at 180*F charge air temperature.
So, while an improvement in cooling by the intercooler will naturally improve power and torque by providing a cooler, more dense air charge to the engine, it is important to understand that airmass targets and ignition timing advance will be impacted by these changes too.
A: Power/Torque
Both COBB intercooler prototypes offered significant power increases over stock. The COBB1 intercooler saw an average peak increase of +13.1WHP, while the COBB2 prototype yielded an average peak increase of +11.8WHP. Two of the seven total runs for the COBB1 intercooler were unexpectedly low compared to the other five. Without engine datalogs to show a complete picture of what caused that power loss we are forced to speculate the cause. However, if we are to eliminate these outliers from the average, we see an average peak increase of +16.4WHP.
Peak torque gains were minimal due to the location of the torque peak early in the dyno run where the turbochargers had not yet put a lot of heat into the system. As a result, the prototype intercoolers did not have the opportunity to demonstrate improved performance. A revised testing plan in the future using steady state power/torque measurement or using a higher gear could demonstrate the benefits at lower RPM near the torque peak. That said, average WTQ through the entire pull did see an increase of +7.3WTQ for the COBB1 intercooler, and +5.5 for the COBB2 intercooler.
B: Temperature Efficiency
Impressive reductions in post-intercooler air temperature were found on both prototype COBB intercoolers. COBB1 saw an average ending post-intercooler air temperature of 110.5*F, while COBB2 saw an average ending temperature of 122.5*F, reductions of 39.1*F and 27.1*F respectively compared to the average stock value of 149.6*F.
Another way to demonstrate cooling efficiency improvements is by comparing the ending temperature of pre-intercooler air to the ending temperature of post-intercooler air; in other words, measuring the maximum amount of heat removed from the air charge by passing through the intercooler. The stock unit was able to remove 125.1*F from the air charge, compared to 176.9*F for COBB1 and 161.4*F for COBB2 representing increased heat reduction of 51.8*F and 36.3*F, respectively.
C: Pressure Drop
We were pleasantly surprised to find an improvement in pressure drop on both intercooler prototypes. Compared to an average peak pressure drop (Pre-IC Pressure – Post-IC Pressure) of 1.21psi for the stock design, we saw 1.12psi on COBB1 and 0.70psi on COBB2. Pressure drop is, in part, a measurement of the flow capacity of an intercooler. The greater the resistance to flow, the greater the pressure drop across the intercooler. Internal fin construction, overall core sizing, and end tank design play a significant role in this measurement; thankfully, our designs proved even better than stock despite cooling the air charge much better.
Our pressure data here is not temperature corrected. The ideal gas law tells us that when a given mass of air is cooled, pressure will decrease. With pre-IC air temperature approaching 300*F, the impact that cooling has on post-IC pressure is significant when the intercooler is removing up to 175*F of heat from the air charge. In some ways, pressure drop can represent an effective intercooler, and not necessarily represent an impedance to airflow. Since we are not dealing with a fixed volume as the air charge is passing through the intercooler and is then consumed by the engine, there are limitations to temperature corrected values, so we have decided to show them in their uncorrected format.
Conclusion:
The intercooler design that we chose for production is the COBB1 prototype. While we did see a marginally higher pressure drop on this design – which is consistent with the increased charge-side fin density in the core – any decrement to performance posed by that was clearly offset by its improved cooling capacity compared to the COBB2 core. Lower charge air temperatures with the COBB Bronco intercooler will not only keep the engine consuming cooler, denser air, but will also keep airflow requests and ignition timing advance high to maximize performance run after run.
Our intercooler design has already passed CARB testing and has been issued an EO(D-660-95), making it 50-state legal and ready to buy today! Bolt on real-world performance with the COBB Bronco intercooler!
COBB Front Mount Intercooler 2021-2022 Bronco – Black
COBB Front Mount Intercooler 2021-2022 Bronco – Silver
Leave a Reply